

Whoop vs Oura: What Each Measures Well, Where They Disagree and How Accurate the Sleep Data Are
Key Takeaways
- Both Whoop and Oura detect sleep versus wake with roughly 85 to 95 percent agreement against laboratory polysomnography, but their specificity for wake is often below 60 percent, so both overestimate sleep in people who lie awake.
- Four-stage sleep agreement for consumer trackers generally falls between 60 and 80 percent, with deep sleep the most misclassified stage, which makes cross-brand deep-sleep comparisons close to meaningless.
- Whoop's continuous heart-rate sampling makes it the stronger exertion tracker, while Oura's finger placement gives it the stronger temperature and resting-signal data.
- Oura's cardiovascular age infers arterial stiffness from a single-site pulse waveform and is positioned as a wellness insight without regulatory clearance or extensive independent validation.
- In July 2025 the FDA issued a warning letter about Whoop's beta blood pressure estimate, while the ECG atrial fibrillation prompt on the Whoop MG band is FDA-cleared as a screening feature.
- No randomised trial has shown that acting on a recovery or readiness score improves any health outcome, so both scores are best read as prompts to ask why, not as verdicts.
Whoop and Oura both estimate sleep and recovery from an optical pulse sensor, and both detect whether you are asleep or awake with roughly 85 to 95 percent agreement against laboratory sleep studies. Neither stages sleep reliably; agreement for light, deep and REM typically falls to 60 to 80 percent. Whoop tracks exertion better, Oura tracks temperature and sleep timing better, and neither replaces a medical diagnosis.
A runner I spoke with recently wore both devices to bed for a month, one on her wrist and one on her finger, and kept a spreadsheet. Some mornings the two agreed within minutes. Other mornings one said she had slept seven hours and the other said five and a half. She wanted to know which one was lying. The honest answer, as of early 2026, is that both were guessing, and the interesting question is how good the guesses are.
The whoop vs oura debate has heated up because both companies pushed into territory that looks medical. Oura’s ring began reporting a cardiovascular age. Whoop released a band that can record an electrocardiogram and, in a separate beta feature, estimate blood pressure, which prompted a formal letter from the US Food and Drug Administration in July 2025. Search interest followed.
This piece sets the marketing aside and asks a narrower question: what does each device measure well, where do they disagree, and how far should you trust a number that arrived on your phone before you had finished your coffee?
What changed recently in the Whoop vs Oura comparison
Three dated events explain why this comparison is trending again. In October 2024, Oura released its fourth-generation ring with sensors recessed flush into the inner band, replacing the small domes that earlier models pressed against the finger. The redesign aimed at more consistent optical contact, which matters because every metric downstream depends on a clean pulse signal.
In May 2025, Whoop launched two new bands, a standard 5.0 and a medical-grade version called the MG. The MG added an electrocardiogram, a recording of the heart’s electrical activity taken by touching two electrodes, with a feature cleared by the FDA to flag possible atrial fibrillation. Atrial fibrillation is an irregular, often rapid heart rhythm that raises stroke risk, and the NHS notes it frequently produces no symptoms at all, which is why wearable screening interests cardiologists.
Two months later, in July 2025, the FDA sent Whoop a warning letter about a different feature, Blood Pressure Insights, which estimates blood pressure from the pulse waveform rather than from a cuff. The agency’s position was that estimating blood pressure is a medical-device function requiring clearance; the company’s position was that the feature is for general wellness. That question remained a regulatory matter rather than a scientific verdict on the estimates themselves.
Meanwhile Oura expanded its cardiovascular age and symptom radar features, both framed as wellness insights rather than diagnoses. The pattern across both companies is the same: consumer devices reaching toward measurements that used to require a clinic, while regulators and sleep scientists ask how well the estimates hold up. That is the right frame for the rest of this article.
Whoop vs Oura: how each device actually takes its measurements
Both devices rely on the same core technology. Photoplethysmography, usually shortened to PPG, shines light into the skin and measures how much bounces back as blood volume pulses through small vessels. From that waveform the software derives heart rate, the timing gaps between beats, breathing rate and a rough estimate of blood oxygen. Neither device measures brain waves, and that single fact governs almost everything you will read about sleep accuracy.
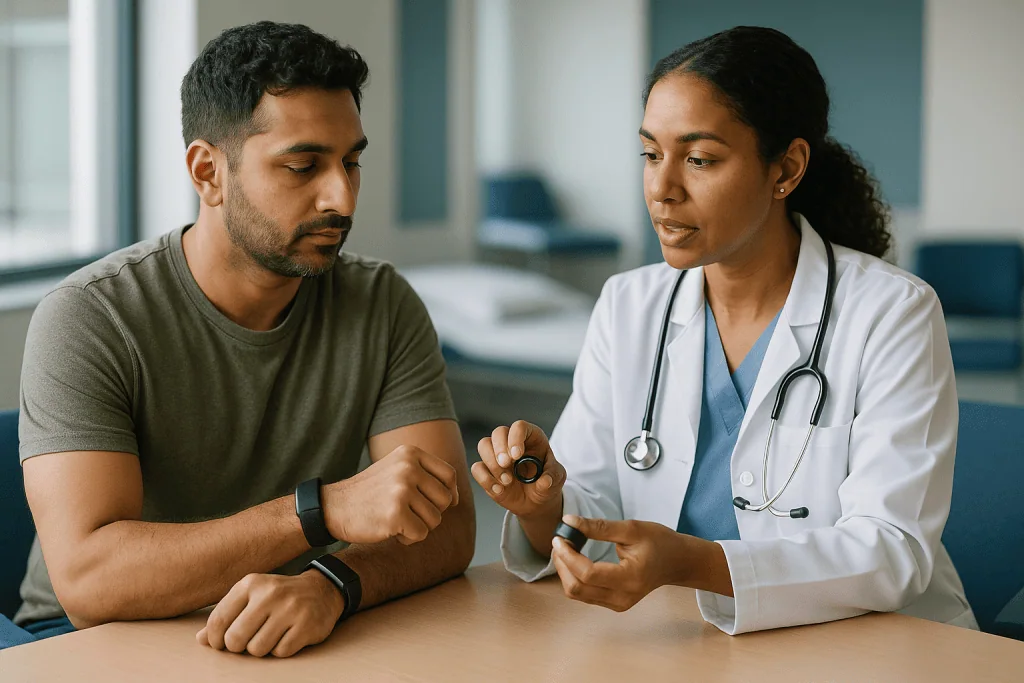
Where they diverge is placement. Oura sits on a finger, where blood flow is rich and the signal tends to be strong and steady at rest. Whoop straps to the wrist by default, though it can also be worn in a bicep band or in pockets sewn into the company’s clothing. Wrist PPG is more vulnerable to motion and to a loose fit, especially during exercise, and several studies have reported lower accuracy in people with darker skin tones or wrist tattoos because melanin and ink absorb the green light many sensors use. Both companies now use additional red and infrared wavelengths partly to address this.
The devices also differ in what they measure continuously. Whoop samples heart rate throughout the day and builds a strain score, an exertion estimate scaled from 0 to 21. Oura measures heart rate periodically during the day and concentrates its heaviest sampling at night. It also carries a temperature sensor that reads skin temperature every few minutes overnight and reports the deviation from your personal baseline.
Neither has a screen, which their fans call a feature. Both require a companion app and a subscription to unlock their interpretive layers. The raw sensor is only the beginning; the algorithm that turns pulses into a recovery percentage is where most of the disagreement lives.
What does Whoop measure well?
Whoop’s strongest suit is exertion. Because it samples heart rate continuously and is designed to be worn during workouts, it can estimate how much cardiovascular load a session imposed. Its strain score is essentially time spent in elevated heart-rate zones weighted by intensity, a concept the American Heart Association uses when it describes target heart rates as percentages of your estimated maximum. Small validation studies against chest-strap electrocardiogram monitors have found wrist PPG heart rate tracks reasonably well during steady running and cycling and less well during interval work or anything involving vigorous wrist movement, such as rowing or lifting.
The device also does a credible job with overnight heart rate variability, or HRV, the beat-to-beat variation in timing between heartbeats. The Cleveland Clinic describes HRV as a window into the balance between the sympathetic and parasympathetic branches of the nervous system, and a 2021 comparison found Whoop’s nighttime HRV and resting heart rate agreed closely with a reference electrocardiogram. That agreement is the foundation of its recovery score.
Whoop’s nightly sleep-wake detection, the binary question of whether you are asleep or awake in each 30-second window, performed comparably to other consumer devices in a 2021 study that tested several trackers against polysomnography in the same people on the same nights.
Where Whoop is weaker is any metric that depends on a sensor other than the pulse. Its skin temperature reading is newer and less validated than Oura’s. Its blood oxygen estimate, like every wrist PPG estimate, is a nightly average rather than a medical pulse oximeter reading. And its strength during exercise is also its limitation: a band tuned for athletes can produce a busy dashboard for someone whose main interest is sleep.
What does Oura measure well?
Oura’s advantage is the finger. Blood flow there is dense, the ring sits snugly without a strap to loosen, and at rest the optical signal is about as clean as wearable PPG gets. That pays off most at night, when the device is doing its heaviest work.
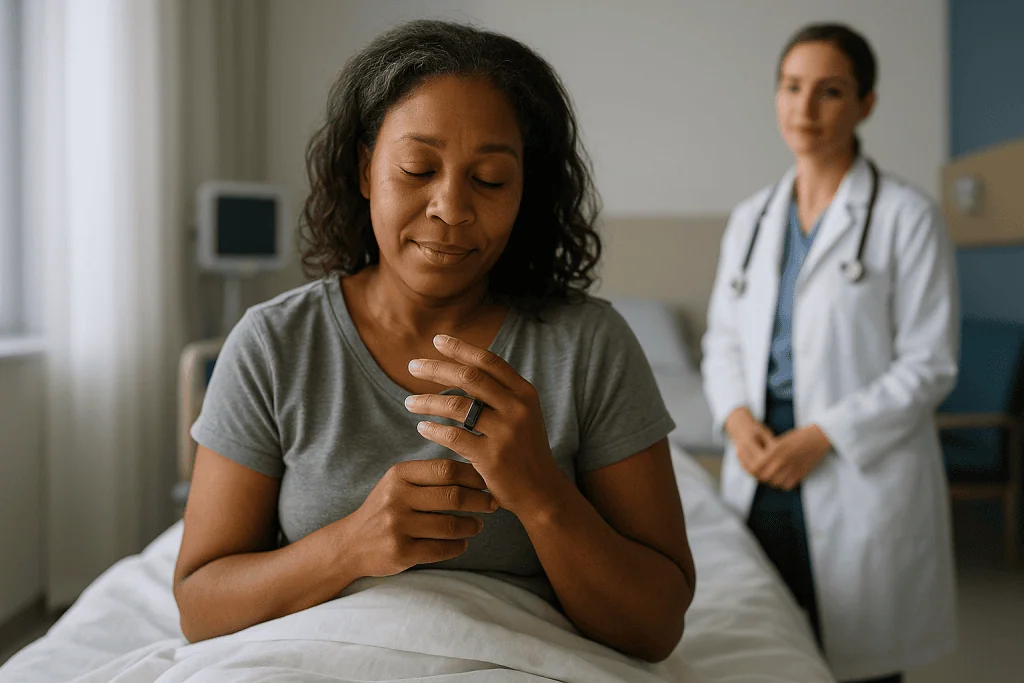
Temperature is the clearest example. Oura reports a nightly skin temperature deviation from your own rolling baseline, and the finger tracks core temperature trends more closely than the wrist. Researchers have used this signal to identify the post-ovulation temperature rise, which is why the ring has been integrated into fertility-awareness features, and to spot the small elevations that often precede a fever. Studies during the pandemic reported that finger-temperature trends sometimes shifted a day or two before people reported symptoms, though the same studies found plenty of false alarms after alcohol, late meals or hot bedrooms.
Sleep timing is another strength. Validation work on the third-generation ring reported sleep-wake agreement in the low 90 percent range against polysomnography, with total sleep time typically within about 20 minutes of the laboratory figure for most participants. Resting heart rate and overnight HRV also track reference measures well, for the same signal-quality reasons.
The trade-off is daytime exertion. Oura measures heart rate intermittently during the day and estimates activity largely from movement, so it can undercount cycling or strength training. The company added continuous workout heart rate and automatic activity detection, and the newest ring tracks a wider set of sports, but a ring that gets knocked against a barbell or squeezed under a glove is still working against its form factor. For people whose question is how well they slept rather than how hard they trained, that is often an acceptable bargain.
How accurate are sleep trackers compared with a sleep study?
The reference standard is polysomnography, an overnight laboratory study that records brain waves, eye movements, muscle tone, breathing and heart rhythm at once. Trained technicians score each 30-second window, called an epoch, as wake, light sleep, deep sleep or REM. Consumer devices have no electrodes on the scalp, so they infer those stages from heart rate, HRV, breathing and movement. It is educated inference, not measurement.
Two numbers describe how well any tracker performs. Sensitivity is the percentage of true sleep epochs the device correctly labels as sleep. Specificity is the percentage of true wake epochs it correctly labels as wake. Consumer devices, Whoop and Oura included, routinely post sensitivity above 90 percent. Their specificity is often far lower, sometimes below 60 percent. In plain terms, they are excellent at knowing you are asleep and mediocre at knowing when you are lying still but awake.
That asymmetry has a predictable consequence: trackers tend to overestimate total sleep in people who spend a lot of time awake in bed and to overreport sleep efficiency. If you fall asleep quickly and rarely wake, your device will look impressively accurate. If you have insomnia, it may flatter you.
Sleep staging is where the numbers drop. When researchers compare each epoch’s stage against the laboratory score, four-stage agreement for consumer devices generally lands between 60 and 80 percent, with deep sleep the most frequently misclassified. The CDC and NIH both note that adults need at least seven hours of sleep, and a tracker can help you notice whether you are getting there. What it cannot do is tell you, minute by minute, which stage your brain was in.
Oura ring accuracy: what the validation studies show
Oura has been studied more than most consumer wearables, partly because its makers published early comparisons and partly because academic sleep laboratories adopted it for research. The picture across a decade of studies is consistent, with some improvement over generations.
A 2019 laboratory study of the second-generation ring in healthy adults found sleep-wake sensitivity around 96 percent and specificity around 48 percent, meaning it caught nearly all sleep but labeled roughly half of awake-in-bed time as sleep. Total sleep time was overestimated by a modest margin. Stage agreement was weakest for deep sleep and REM.
The third-generation ring, released in 2021, moved to a new staging algorithm. A validation paper comparing it against polysomnography reported four-stage agreement near 79 percent and a smaller total sleep time error, a real step forward. A multi-night study in a home setting, using portable electroencephalography as the reference, found the ring tracked night-to-night changes in sleep duration reasonably well, which is arguably the more useful skill for everyday users than single-night precision.
The fourth-generation ring from late 2024 has fewer independent peer-reviewed comparisons so far, which is normal for a device that age. Its sensor redesign was intended to reduce signal dropouts rather than change the underlying inference, so large accuracy gains would be surprising.
Two caveats apply to all of it. Most participants in these studies were healthy adults without sleep disorders, and the algorithms are tuned on similar populations. Accuracy in people with sleep apnea, insomnia, heart rhythm disorders or very fragmented sleep is less well characterised. The fair summary of oura ring accuracy is good for sleep duration, decent and improving for stage estimates, and unproven as a diagnostic tool for anyone whose sleep is already a medical concern.
Whoop sleep and recovery accuracy: what the studies show
Whoop’s published record is thinner than Oura’s but points in a similar direction. A 2020 validation study compared the strap against polysomnography in healthy young adults and reported two-stage sleep-wake agreement close to 90 percent, with sensitivity in the mid-90s and specificity around 50 to 60 percent, the familiar consumer-device pattern. Total sleep time was slightly overestimated. Four-stage agreement was in the 60s, with light sleep the most common confusion.
A separate study the same year, also in young healthy adults, found the strap’s nightly heart rate and HRV agreed closely with electrocardiogram measurements, with mean differences that were small enough to be practically meaningless for trend-watching. That matters because Whoop’s recovery score leans heavily on those two inputs plus respiratory rate and sleep performance.
The most informative study is the 2021 head-to-head comparison that placed several consumer devices, including both Whoop and Oura, on the same participants during laboratory nights. Sleep-wake performance clustered tightly across devices, with no consumer tracker clearly beating the others, and every device struggled with staging in the same way. The lesson was not that one brand had cracked the problem but that the problem is inherent to inferring brain state from the pulse.
Whoop’s newer bands have not yet accumulated independent peer-reviewed sleep validation. The company reports internal testing, which is useful context but not equivalent to an outside laboratory publishing its raw agreement statistics.
One structural point: Whoop’s recovery percentage is a proprietary composite with no medical reference standard to validate against. Researchers can check whether its HRV is accurate. They cannot check whether 67 percent recovered is correct, because no laboratory measurement defines what that means.
Why do Whoop and Oura disagree when worn at the same time?
Wear both to bed and you will see disagreements, and they cluster into predictable types.
The first is the edges of the night. Deciding when sleep began and ended is the hardest call for any device, because lying still in the dark looks like sleep to a motion-and-pulse sensor. If Oura marks sleep onset at 11:12 and Whoop at 11:31, a 19-minute gap has opened before either has staged a single epoch. Add a similar disagreement at wake time and the total-sleep difference can exceed half an hour on a night when both are performing within their published error.
The second is staging. Each company trains its own algorithm on its own reference data, and the two models weigh HRV, breathing and movement differently. Deep sleep is the biggest casualty. One device may credit you 90 minutes of deep sleep and the other 45, and the laboratory answer could sit anywhere in between. Comparing deep-sleep totals across brands is close to meaningless.
The third is naps and awakenings. Whoop treats naps as separate sleep events that feed the daily total; Oura may fold a short daytime rest into activity if it does not detect enough stillness. Brief nighttime awakenings are caught inconsistently by both.
The fourth is signal quality on a given night. A ring that rotated so the sensors sat over the knuckle, or a band that loosened, will produce dropouts and the algorithm will fill gaps with its best guess. Good practice for either device is checking fit before sleep and looking at trends over weeks rather than any single number.
None of this makes either device wrong. It makes them two estimates of a thing neither can directly see.
Is HRV a reliable recovery signal?
Both devices center their readiness scores on heart rate variability, so it is worth being precise about what it is and is not. HRV is the variation, measured in milliseconds, in the intervals between consecutive heartbeats. Higher variability at rest generally reflects stronger parasympathetic, or rest-and-digest, activity, while a drop can accompany illness, alcohol, poor sleep, heavy training or psychological stress.
The physiology is well established. Decades of research, much of it using multi-hour electrocardiogram recordings, link lower HRV to worse cardiovascular outcomes at the population level. The Cleveland Clinic summarises HRV as a useful indicator of how well the body adapts to stress, while cautioning that normal ranges vary enormously between people. A 25-year-old endurance athlete and a healthy 60-year-old might differ by a factor of three with neither being unwell.
That variability is why both Whoop and Oura compare your HRV with your own baseline rather than with population norms, and it is the right design choice. The evidence that a personal HRV dip predicts something useful is more mixed. In athletes, studies that adjusted training around daily HRV have shown modest fitness gains over fixed programs in some trials and no difference in others. In the general population there are almost no controlled trials showing that acting on a wearable HRV score improves health outcomes.
A practical way to hold this: an overnight HRV that is sharply below your average is a reasonable prompt to ask why. Did you drink, sleep badly, catch a cold, train hard? It is not a verdict. The direction of the trend over weeks is more informative than a single morning’s figure, and a low score on its own is never a reason to skip a prescribed medicine, alter treatment or diagnose yourself with anything.
What is Oura ring cardiovascular age, and does it mean anything?
In 2024 Oura began reporting a cardiovascular age, expressed as a number of years above or below your actual age. The feature estimates arterial stiffness, the degree to which the large arteries have lost their youthful elasticity, from the shape and timing of the pulse waveform captured by the finger sensor. Stiffer arteries transmit the pressure wave faster and change the waveform’s contour, and the software translates those features into an age-equivalent.
The concept has a real medical pedigree. Pulse wave velocity, the speed at which the pressure wave travels between two points on the arterial tree, is a validated measure of arterial stiffness and an independent predictor of cardiovascular events in large cohort studies. Clinics measure it with specialised equipment and two sensors at defined distances.
A ring has one sensor at one point, so it cannot measure pulse wave velocity directly. It infers stiffness from single-site waveform analysis, a technique that has shown moderate correlation with reference measurements in research settings but with considerable individual scatter. The company positions the feature as general wellness information, not a diagnostic tool, and it does not have regulatory clearance as a medical device. Independent peer-reviewed validation of the specific age-equivalent output is limited.
How should a reader interpret a cardiovascular age five years above their own? As a nudge, not a finding. The interventions that genuinely lower arterial stiffness are the unglamorous ones the American Heart Association already recommends: regular aerobic activity, blood pressure control, not smoking, and a diet lower in sodium. If a wearable number motivates those habits, it has done something useful. If it prompts anxiety or a request for tests you would not otherwise need, the conversation to have is with a clinician, who will use a cuff, a lipid panel and your history rather than a ring.
Why did Whoop's blood pressure feature draw regulatory attention?
People searching for a Whoop controversy usually mean one of two things, and it is worth separating them plainly.
The first is regulatory. Whoop’s 2025 bands introduced Blood Pressure Insights, a beta feature that estimates systolic and diastolic pressure from the PPG waveform after the user enters a few cuff readings for calibration. In July 2025 the FDA issued a warning letter stating that estimating blood pressure is a function of a medical device and that the feature would need clearance. The company responded that the feature is intended for general wellness and is not a substitute for a cuff. As of this writing the disagreement is about which regulatory category the feature belongs in. It is not a finding that the estimates are inaccurate, and it is not a finding that they are accurate either, because the independent validation data that would settle that question have not been published.
For readers, the medical point is simpler than the legal one. Cuffless blood pressure estimation from a single optical sensor is an active research area, and studies to date show it can track changes in a person’s pressure over hours but drifts without recalibration and performs unevenly across individuals. Hypertension is diagnosed with a validated cuff, ideally with repeated home or ambulatory readings, and treatment decisions rest on those.
The second thing people mean is a customer-relations episode from the same product launch, when initial terms for upgrading to the new hardware drew widespread complaint and the company revised them within days. That is a business story rather than a health one, and beyond noting that it happened, it has no bearing on what the sensor measures.
The atrial fibrillation feature on the MG band is a different matter. That electrocardiogram function received FDA clearance, placing it in the same category as similar features on several smartwatches: a screening prompt that a clinician confirms with a proper 12-lead recording.
Whoop vs Oura at a glance: a side-by-side summary
The table below condenses the comparison into the dimensions that matter most for health-minded users. Accuracy figures are approximate ranges drawn from the peer-reviewed validation literature discussed above, and they describe healthy adult populations.
| Dimension | Whoop | Oura |
|---|---|---|
| Sensor location | Wrist by default; bicep and clothing options | Finger |
| Sleep-wake agreement vs polysomnography | Roughly 86 to 90 percent | Roughly 88 to 93 percent |
| Four-stage sleep agreement | Roughly 60 to 70 percent | Roughly 65 to 80 percent |
| Overnight HRV and resting heart rate | Close agreement with ECG in validation | Close agreement with ECG in validation |
| Exercise heart rate | Strongest of the two; continuous sampling | Improved, still limited by form factor |
| Skin temperature trend | Newer, less validated | Well studied; strongest of the two |
| Regulated medical feature | ECG atrial fibrillation prompt on MG band (FDA-cleared) | None |
| Unregulated estimate under scrutiny | Blood pressure insights (beta) | Cardiovascular age |
| Best suited to | Training load, athletes, exercise data | Sleep, temperature, cycle tracking, comfort |
A few readings of the table. The sleep numbers overlap more than they differ; the gap between the two devices is smaller than the gap between either device and the laboratory. The genuine separation is in daytime exertion, where Whoop’s design wins, and in temperature, where Oura’s finger placement wins.
The final two rows deserve attention. Each company has one feature that steps toward medicine. One is cleared, one is under regulatory review, and one is positioned as wellness. Knowing which is which is more useful than knowing either device’s deep-sleep total.
What the evidence actually says, graded by strength
Evidence about wearables comes in layers of varying reliability, and readers deserve to know which layer supports which claim.
Strongest: small laboratory validation studies against polysomnography. These are direct comparisons, epoch by epoch, in the same people on the same nights. They exist for both Whoop and Oura and consistently show high sensitivity for sleep, low specificity for wake, and moderate stage agreement. Their limitation is size, typically 20 to 60 participants, and their reliance on healthy volunteers. The conclusion that both devices estimate sleep duration well and stages imperfectly is about as solid as consumer wearable science gets.
Moderate: validation of heart rate and HRV against electrocardiogram. Several independent studies support close agreement at rest and overnight for both devices, with wider error during vigorous movement, particularly at the wrist. This is observational comparison data with physiologic plausibility.
Weak to absent: evidence that using either device improves a health outcome. No randomised trial has shown that following a Whoop recovery score or an Oura readiness score reduces injury, illness, blood pressure or mortality. Trials of HRV-guided training in athletes show small and inconsistent fitness gains. Studies of temperature-based illness detection show promising signals with high false-positive rates. For cardiovascular age and cuffless blood pressure estimates, independent validation of the specific outputs is limited, and their clinical value is unknown.
Expert opinion, meanwhile, is fairly aligned. Sleep medicine societies describe consumer trackers as useful for raising awareness of sleep habits and for tracking trends, and inappropriate as diagnostic tools. The NIH and CDC recommendations on sleep duration are grounded in large cohort studies, not in wearables, and a device is a tool for seeing whether you meet them.
The honest summary: both devices are well validated for the questions they were originally built to answer, and unvalidated for the medical-sounding questions they have recently started asking.
Common myths about Whoop and Oura, corrected
Viral comparisons tend to circulate a few claims that the evidence does not support. Here are the most common, each with what the research actually shows.
Myth: one of them is medically accurate for sleep stages. Neither is. Both infer stages from the pulse, both lose agreement with the laboratory once you move past sleep versus wake, and both confuse light and deep sleep frequently. A 20-minute difference in deep sleep between nights is well inside the noise.
Myth: a low recovery or readiness score means you are ill or overtrained. The scores are composites of HRV, resting heart rate, breathing rate and sleep. Any of those can shift after alcohol, a late meal, a warm room, an anxious evening or a shift in the menstrual cycle. A low score is a question, not a diagnosis.
Myth: the ring can tell you your true cardiovascular age. It estimates arterial stiffness from a single-site waveform, a technique with moderate correlation to reference measures and no regulatory clearance. It is a wellness prompt.
Myth: the band can measure your blood pressure. It estimates pressure after cuff calibration, drifts over time, and the FDA has questioned whether the feature requires clearance. Hypertension is diagnosed and monitored with a validated cuff.
Myth: the blood oxygen reading detects sleep apnea. Both devices report an overnight average from a wrist or finger optical sensor. Sleep apnea, a condition in which breathing repeatedly stops during sleep, is diagnosed by a sleep study that counts individual events per hour. Some trackers flag breathing irregularities, which can be a reasonable prompt to seek evaluation, but a normal average does not rule the condition out.
Myth: wearing a tracker improves sleep. It can improve awareness. Some people, particularly those prone to anxiety about sleep, find that watching the numbers makes their sleep worse, a pattern sleep clinicians have named orthosomnia.
Why are people getting rid of their Oura rings, and is Whoop still worth it in 2026?
Both devices have loyal users and both have people who quietly stopped wearing them. The reasons, gathered from user surveys and clinician observations, say something about their real downsides.
For the ring, the most cited complaint is physical. A ring collides with barbells, kettlebells, climbing holds and pull-up bars; the outer shell scratches and, more importantly, pressure against the finger can rotate the sensors away from the skin during training. Some users report skin irritation under the band, especially when it is worn continuously and wet. Sizing is a second issue, since fingers swell and shrink with temperature, hydration and salt intake, and a ring that fits in January can be tight in July. A third reason is more psychological: some users find that a daily readiness score becomes one more thing to be graded on, and they feel better without it.
For the band, the recurring downside is that it is built for athletes and can overwhelm anyone else. The strain-and-recovery framing implies that every day should be optimised, which suits someone training for a marathon and can grate on someone recovering from surgery or simply trying to sleep more. The strap needs charging on the wrist, which some find fiddly, and wrist PPG is less forgiving of a loose fit or heavy tattoos. Users on forums also cite the sense that recent features push toward medical territory faster than independent validation arrives.
Is either still worth wearing? The evidence-based answer is that both remain good instruments for the questions they were designed around. If your priority is exertion and training load, the band measures that better. If your priority is sleep, temperature and comfort, the ring does. If your priority is a diagnosis, neither is the right tool, and the money and attention are better spent on a clinician.
When to see a doctor about what your tracker shows
A wearable is a screening prompt at best. Certain patterns and symptoms should move you from the app to a clinic, regardless of what the score says.
Seek prompt medical care for chest pain or pressure, fainting, sudden shortness of breath, a racing or pounding heart that does not settle with rest, or a one-sided weakness, facial droop or speech difficulty. These are emergencies; do not wait to see whether the device confirms them.
Make an appointment if your tracker repeatedly flags irregular heart rhythm, especially the atrial fibrillation prompt on an ECG-capable band. The NHS notes atrial fibrillation often causes no symptoms yet raises stroke risk, and a clinician can confirm or exclude it with a proper electrocardiogram. A persistently elevated resting heart rate over several weeks, or a large unexplained drop in your usual HRV that does not recover, is also worth discussing.
See a doctor about sleep if you snore loudly, wake gasping, or feel unrefreshed after what the device reports as adequate sleep. The Mayo Clinic lists daytime sleepiness, morning headache and difficulty concentrating among the signs of sleep apnea, a condition diagnosed by sleep study rather than by a wrist or finger sensor. Insomnia lasting more than three months, or that affects your work, mood or safety, deserves evaluation; effective treatments exist and do not require a tracker.
Consult your clinician before acting on any device reading if you take medicines for blood pressure, heart rhythm, thyroid function or sleep, or if you are pregnant. Never adjust or stop a prescribed medicine because a wearable score moved. If a cardiovascular age or blood pressure estimate concerns you, bring it to your appointment as a question; the decision about what, if anything, to do belongs with the clinician who can examine you.
Frequently asked questions
Is Whoop or Oura more accurate for sleep?
They are closer than most reviews suggest. In head-to-head laboratory testing, sleep-wake agreement clustered within a few percentage points for both, and both struggled with staging in the same way. Oura’s finger sensor gives it a slight edge for total sleep time and temperature at night; Whoop matches it on overnight heart rate and HRV. Neither reliably reports deep or REM sleep, so choosing between them on staging accuracy is not well supported by evidence.
How accurate is the Oura ring compared with a sleep study?
Validation studies report the third-generation ring detects sleep versus wake with roughly 90 percent agreement against polysomnography and estimates total sleep within about 20 minutes for most healthy adults. Four-stage agreement was near 79 percent in the best study, an improvement over earlier generations. Accuracy in people with insomnia, sleep apnea or rhythm disorders is less established because most studies enrolled healthy volunteers.
What is the Whoop controversy people are searching for?
It refers mainly to a July 2025 FDA warning letter about Whoop’s beta Blood Pressure Insights feature, which estimates blood pressure from the optical pulse signal. The FDA’s position was that this is a medical-device function requiring clearance; the company’s position was that it is a wellness feature. The disagreement concerns regulatory category rather than a published finding about accuracy. A separate customer complaint about hardware upgrade terms at the same launch was a business matter, not a health one.
Why are people getting rid of their Oura rings?
Common reasons include damage and sensor rotation during weight training, skin irritation under a ring worn constantly, sizing problems as fingers swell with heat or salt, and the requirement of an ongoing subscription to see most insights. Some users also describe feeling graded by a daily readiness score and sleeping better once they stopped checking it, a pattern sleep clinicians call orthosomnia.
What is the downside of Whoop?
Its main limitations are wrist optical sensing, which is more affected by motion, loose fit, tattoos and darker skin than a finger sensor, and a strain-and-recovery framing built for athletes that can feel relentless to everyone else. Its temperature and blood oxygen estimates are less validated than its heart-rate data, and its newest medical-sounding features, apart from the FDA-cleared ECG prompt, lack independent peer-reviewed validation so far.
Is Whoop still worth it in 2026?
For someone whose main interest is training load and exercise heart rate, the evidence supports it as a capable tool, with overnight HRV and resting heart rate that agree closely with electrocardiogram in validation studies. For someone mainly interested in sleep or temperature, a ring may fit the purpose better. For anyone seeking a diagnosis, neither device is the right instrument, and a clinician is.
What does Oura ring cardiovascular age actually measure?
It estimates arterial stiffness from the shape and timing of the pulse waveform at the finger and converts that into an age-equivalent relative to your actual age. Arterial stiffness measured by clinical pulse wave velocity is a validated predictor of cardiovascular risk, but a single-sensor ring infers it indirectly with considerable individual scatter. Oura positions the number as wellness information, and it does not have regulatory clearance as a medical device.
Can Whoop or Oura detect sleep apnea?
No. Both report an overnight blood oxygen average and some breathing regularity metrics, which can be a reasonable prompt to seek evaluation if they look unusual. Sleep apnea is diagnosed by a sleep study that counts breathing interruptions per hour along with oxygen dips and brain-wave arousals. Loud snoring, gasping awake or unrefreshing sleep warrant a medical appointment regardless of what a tracker reports.
Why does my HRV differ between Whoop and Oura?
The two devices measure HRV over different windows and report different statistics. Whoop uses a weighted average across sleep; Oura reports an average across the night and also shows the overnight curve. Sensor location changes the raw signal too. Absolute values are therefore not comparable across brands, and both companies rightly compare you with your own baseline rather than with each other or with population norms.
Should I act on a low recovery or readiness score?
Treat it as a question rather than an instruction. Alcohol, a late meal, a warm room, an anxious evening, a hard workout or a shift in the menstrual cycle can each lower the score without indicating illness. If the trend stays low for weeks, or you have symptoms such as palpitations, chest discomfort or unusual breathlessness, see a clinician. Never change or stop a prescribed medicine because a wearable score moved.
References
- Cleveland Clinic: Heart Rate Variability (HRV)
- CDC: About Sleep
- NHS: Atrial fibrillation
- MedlinePlus: Healthy Sleep
This article is for general information only and is not a substitute for professional medical advice. Please consult a qualified doctor about your individual situation.

More from the Blog

Smart Rings Compared: Galaxy Ring, Ultrahuman and Oura: What They Measure Well
The Samsung Galaxy Ring, Oura Ring and Ultrahuman Ring Air all use an optical sensor on the finger to track resting heart rate, nighttime…

Palliative Chemotherapy: What the Term Means
Palliative chemotherapy is chemotherapy given with the aim of controlling a cancer rather than curing it. Its goals are to shrink or slow tumors,…
How Radiotherapy Works and How Long Sessions Take
A single external radiotherapy session usually takes about 10 to 30 minutes, and the beam itself is switched on for only a few minutes…

AI Symptom Checkers and ChatGPT Medical Advice: How Accurate Are They, Really?
AI symptom checkers and chatbots such as ChatGPT are reasonably good at flagging emergencies and at listing plausible causes, but they are not reliable…

AI in Radiology: How Algorithms Read Mammograms and CT Scans, and Why a Radiologist Still Signs the Report
AI in radiology means software trained on large image datasets that flags suspicious areas on mammograms and CT scans, sorts urgent cases to the…

Deep Brain Stimulation: What It Is and How Long It Lasts
Deep brain stimulation is a surgical treatment in which thin electrodes are placed in specific areas of the brain and connected to a small…